How Australian households became the most indebted in the world
The results are in: Australian households have more debt compared to the size of the country’s economy than any other in the world.
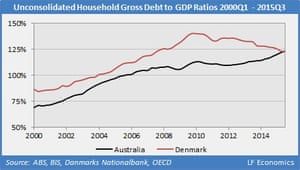
Research by the Federal Reserve has shown the consolidated household debt to GDP ratio increased the most for Australia between 1960 and 2010 out of a select group of OECD nations. Australia’s household sector has accumulated massive unconsolidated debt compared with other countries. As of the third quarter of 2015, it now has the world’s most indebted household sector relative to GDP, according to LF Economics’ analysis of national statistics.
Denmark long held this unholy accomplishment, but has been slowly deleveraging over the last several years as its housing bubble peaked and burst during the GFC. The latest debt-financed boom in Sydney and Melbourne has resulted in Australia now overtaking Denmark, a comparison of official figures from Australia and Denmark has shown.
Australia has around $2 trillion in unconsolidated household debt relative to $1.6 trillion in GDP. Australia’s ratio is 123.08%, while Denmark’s fell slightly to 122.99% in the third quarter of 2015, a marginal difference of 9 basis points. Although Denmark holds the record in terms of peak debt of 140.14% in the last quarter of 2009, as Australia continues to leverage and Denmark deleverages the current gap between the two will widen. Apart from Switzerland (which alongside Denmark has a negative interest rate), no other country is close in terms of having such extreme household sector debts. The UK ratio is 85.9% while in the US it is 79.1%.
Due to Switzerland’s opaque financial accounts, it is impossible to calculate a figure for this quarter. Its ratio for the second quarter of 2015 is 121.3%, and household debt is rising very slowly, so it would take an extraordinary increase over the quarter to potentially beat Australia.
The final confirmation of the trend is expected when the Bank of International Settlements publishes its analysis of private credit statistics from the third quarter.
Australian property investors and homeowners are burdened with massive mortgages, especially new and marginal entrants. Unlike winning a gold medal at the Olympics, having the world’s most indebted household sector is not an achievement the nation should be proud of. This is where Australia’s real debt and deficit problem lies, not in the public sector.
Over the last two decades, Australia has been beset by rampant housing price inflation.
Since 1996, prices have outpaced fundamentals such as inflation, incomes, construction costs, rents and GDP, making it difficult for potential first home buyers to enter the marketwhile lower income households and marginal groups struggle to afford decent shelter.
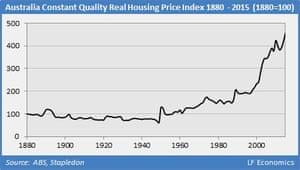
Between 1996 and 2015, housing prices (adjusted for inflation and quality) have boomed by 141%, without a large and obvious downturn. This surge has led to a heated debate over whether this constitutes an asset bubble. Unfortunately, the Australian housing market shares similarities with countries afflicted by such bubbles: the United States, Spain, Denmark, the Netherlands and Ireland.
Government, the FIRE sector (finance, insurance and real estate) and the mainstream economics profession deny the existence of a real estate bubble, but Australia’s economic history demonstrates they occur repeatedly, with all signs pointing to one today.
Contrary to the analyses of the vested interests, the data clearly establishes Australia is in the midst of the largest housing bubble on record.
Government is caught between a rock and a hard place, as implementing needed reforms will likely burst the bubble, causing severe financial and economic problems as residential land prices decline. The FIRE sector, including the public caught in the fallout, will surely blame government for the bust and deflect attention away from the gargantuan amount of debt pumped out by lenders.
One of the faults of real estate analysis is the failure to distinctly define an asset bubble, so debate on the matter is kept necessarily vague. Only a couple of housing market metrics is needed to identify a bubble, and are now considered commonplace: nominal price to inflation, price to income and price to rent. On all three, Australia is both historically and internationally at or near the top.
Since the advent of the GFC, it has become commonly accepted that the global real estate booms originated from rapidly expanding bank credit or private mortgage debt. It is not merely the growth of mortgage debt (the first derivative) but the acceleration (the second derivative), also known as the change in the rate of growth. Nevertheless, the simple growth of mortgage debt provides a strong indicator for housing price growth.
The future for investors and new homeowners is not good. Subdued capital price growth in the secondary capital cities, rental price growth at record lows, significant dwelling construction and a falling population growth rate leading to further oversupply all spell danger. The problems are compounded by the Reserve bank having little room for interest rate cuts, by weak macroprudential controls, minimal savings, low household income growth and anaemic GDP growth.
Captured by neoliberal ideology and the FIRE sector, government has no interest in stopping this immensely profitable yet dangerous gravy train, having enriched the already wealthy beyond avarice through privatisation of unearned economic rents rather than productive activity.
Philip Soos is the co-author of Bubble Economics: Australian Land Speculation 1830-2013 and co-founder of LF Economics. @PhilipSoos


No comments:
Post a Comment